Other available dashboards: by region


About the Texas COVID-19 Dashboard data
Real-time data is messy and we see the ramifications of this in a few of our graphs. The interpretations of this data should be considered in light of several limitations. Briefly,
- Data source:Texas Department of State Health Services。
- 州级的日常数据(我们正在展示)将与县级仪表板不同。这是由于该县到州的报告滞后。
- Testing and cases data are underestimated. This is because not all clinics are reporting data in a comprehensive, systematic manner. As time moves on, this data gets more and more accurate to reflect the "true" burden in Texas.
- 5月19日之后的Covid19阳性病例不包括抗体测试。
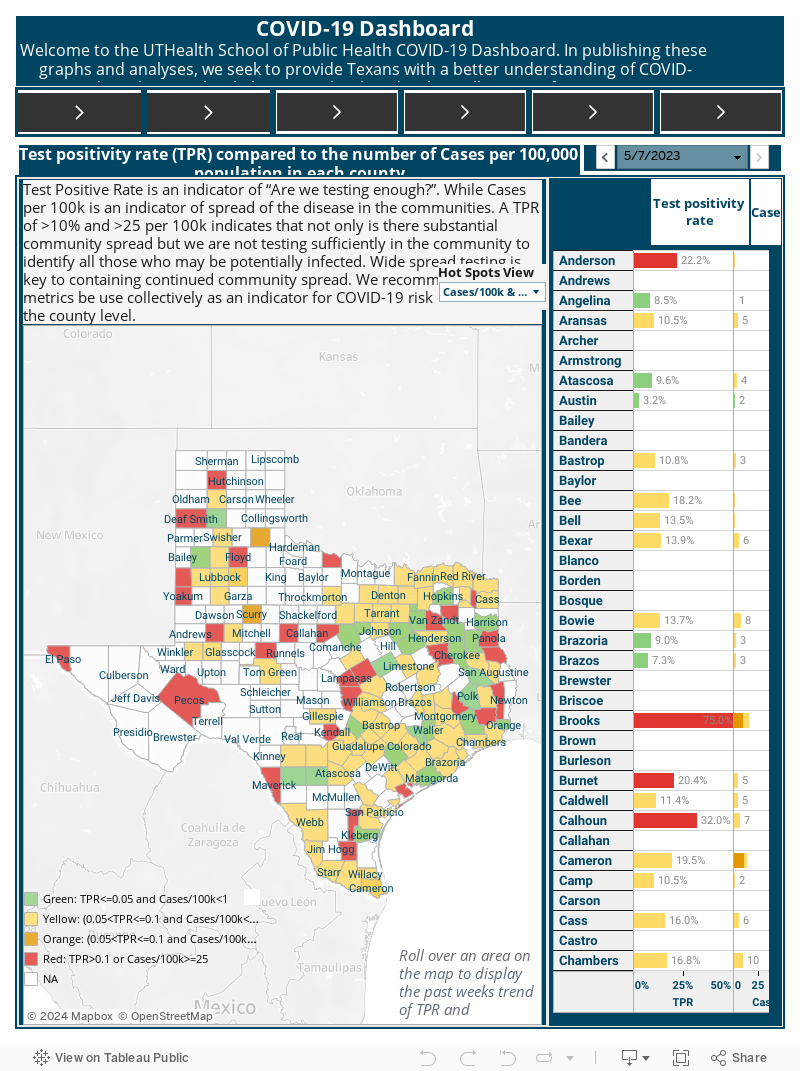
- There are data dumps for smaller counties. A "data dump" is a large amount of cases counted on one date instead of spread over time. We probably see this, for example, in Anderson county on June 17. This impacts projection, hot spots, and R(t) analyses. Interpret cautiously.
- There are some situations where the daily cases are negative. This may be due to retrospective county corrections. The models “smooth” the data to account for these outliers, but larger outliers may still have significant influence on analyses.
- On March 24, 2020, all hospitals were mandated to report COVID19 hospitalizations to the状态。To systemize reporting, the Hospital Preparedness Program Providers (HPP) created 8 subgroups across Texas in charge of collecting hospital data and reporting to the state. To keep reporting consistent throughout the state, DSHSdefined key metrics。简要地,
- COVID19 hospitalization: confirmed PCR or suspected COVID19.
- Suspected COVID19: 1) patient with respiratory illness AND no other obvious causes AND no travel within 14 days; 2) respiratory illness AND has been in contact with a confirmed COVID19 person; 3) severe respiratory illness AND requires hospitalization AND no other obvious explanation.
- Bed availability: Defined as including hospital bed, ICU beds and surge bed availability as reported by the hospitals to the state. Hospital, ICU, or surge bed availability must only be reported to the state if they are staffed.
- Ventilator availability: Total number of adult ventilators available, to include adult ventilators that are capable of ventilating a pediatric patient. Any device used to support, assist or control respiration through the application of positive pressure to the airway when delivered via an artificial airway.
Hospitals, cities and counties may adjust the availability of hospital beds as cases increase or decrease within their jurisdictions.
德克萨斯州Covid-19仪表板数据的统计建模的详细信息
R(t) was estimated using the R0 package in R. The generation time estimates were generated using a gamma distribution with mean 3.96 and standard deviation 4.75, based on estimates from Ganyani, et al. 2020. We investigated several options based on the literature and found this choice of distribution and parameters to not affect the results significantly. Some of the R(t) estimates may be unreliable for counties with “data dumps”. Interpret cautiously for these counties as we are not able to observe the trend over time. To smooth the data, we used 7-day moving averages in the R(t) estimation. Case reports are lagged from test administration (at the beginning the lag was closer to 2-3 weeks and by May it was closer to 2-5 days), thus what we currently are able to estimate is a reflection of tests performed several days prior. This lag may differ by county, hospital, and testing center. R(t) is only estimated for counties who have had at least 50 total cases.
Ganyani T,Kremer C,Chen D,Torneri A,Faes C,Wallinga J,Hens N.基于症状发作数据,估计冠状病毒病的发电间隔(Covid-19),2020年3月。2020年4月30日; 25(17):2000257。
为了建立新案例的预测,建立了自动回归综合移动平均值(ARIMA)模型,建立在7天的新案例移动平均值上,以预测未来的10天。使用R中的Auto.arima函数选择了自动估计的顺序,差异程度和模型的移动平均值,根据Aikake信息标准选择最佳模型。如果每日最大病例的数量太低,则不会产生估计。这些预测的局限性包括:(1)这些预测纯粹是基于以前的数据趋势,目前尚未考虑任何协变量;(2)预测对于具有数据转储的县可能不可靠;(3)案例报告滞后于测试管理(一开始就接近2-3周,到5月,它已经接近2-5天),因此我们目前能够估计的是对执行测试的反映前几天。该滞后可能因县,医院和测试中心而有所不同。
德克萨斯州Covid-19仪表板数据的Uthealth公共卫生小组
学院:
- Ashraf Yaseen, PhD, Assistant Professor of Data Science
- 何塞·米格尔·雅马尔(Jose-Miguel Yamal)博士,生物统计学和数据科学副教授
- Shreela Sharma, PhD, Professor of Epidemiology
- Katelyn Jetelina, PhD, Assistant Professor of Epidemiology
- Bijal Bala, PhD, Associate Professor of Epidemiology
- nalini Ranjit, PhD, Associate Professor of Health Promotion and Behavioral Sciences
- Alanna Morrison,博士,人类遗传学和环境科学系教授兼主席
Staff:
- Michael Gonzalez
- Rachel Atterstrom
学生:
- 杰弗里·布伦南(Jeffrey Brennan)
- Alison Rector
- 塔拉Prezioso
- Hongyin Lai
- Swaminathan Kumar
- Sungjin (Elin) Cho
- Yuan Li
- 秦王
- Mira Jain
- Rachit Sabharwal
流行病学,人类遗传学和环境科学系慷慨地提供了对仪表板的支持。教师在得克萨斯大学健康科学中心公共卫生学院的生物统计学和数据科学系以及流行病学,人类遗传学和环境科学系任命。
More dashboards
In collaboration with North East Texas Health Department (NETHealth), UTHealth-school of public health in Brownsville, UTHealth-school of public health in Tyler we provide the following dashboards:
Resources
Coming soon!